Wine Quality Data preliminary analysis
The wine quality data set comprises of two sets of data of chemical analysis of wines: one set of white wine data and another set of red wine data. Initial analysis is performed separately on these two sets.
For combined analysis, I added a 13th feature called 'kind' which can take on two values: red, white. The ARFF file for Weka classification analysis is here.
A simple overview of the two sets (white, and then red), in R:
> str(white)
'data.frame': 4898 obs. of 12 variables:
$ fixed.acidity : num 7 6.3 8.1 7.2 7.2 8.1 6.2 7 6.3 8.1 ...
$ volatile.acidity : num 0.27 0.3 0.28 0.23 0.23 0.28 0.32 0.27 0.3 0.22 ...
$ citric.acid : num 0.36 0.34 0.4 0.32 0.32 0.4 0.16 0.36 0.34 0.43 ...
$ residual.sugar : num 20.7 1.6 6.9 8.5 8.5 6.9 7 20.7 1.6 1.5 ...
$ chlorides : num 0.045 0.049 0.05 0.058 0.058 0.05 0.045 0.045 0.049 0.044 ...
$ free.sulfur.dioxide : num 45 14 30 47 47 30 30 45 14 28 ...
$ total.sulfur.dioxide: num 170 132 97 186 186 97 136 170 132 129 ...
$ density : num 1.001 0.994 0.995 0.996 0.996 ...
$ pH : num 3 3.3 3.26 3.19 3.19 3.26 3.18 3 3.3 3.22 ...
$ sulphates : num 0.45 0.49 0.44 0.4 0.4 0.44 0.47 0.45 0.49 0.45 ...
$ alcohol : num 8.8 9.5 10.1 9.9 9.9 10.1 9.6 8.8 9.5 11 ...
$ quality : int 6 6 6 6 6 6 6 6 6 6 ...
> str(red)
'data.frame': 1599 obs. of 12 variables:
$ fixed.acidity : num 7.4 7.8 7.8 11.2 7.4 7.4 7.9 7.3 7.8 7.5 ...
$ volatile.acidity : num 0.7 0.88 0.76 0.28 0.7 0.66 0.6 0.65 0.58 0.5 ...
$ citric.acid : num 0 0 0.04 0.56 0 0 0.06 0 0.02 0.36 ...
$ residual.sugar : num 1.9 2.6 2.3 1.9 1.9 1.8 1.6 1.2 2 6.1 ...
$ chlorides : num 0.076 0.098 0.092 0.075 0.076 0.075 0.069 0.065 0.073 0.071 ...
$ free.sulfur.dioxide : num 11 25 15 17 11 13 15 15 9 17 ...
$ total.sulfur.dioxide: num 34 67 54 60 34 40 59 21 18 102 ...
$ density : num 0.998 0.997 0.997 0.998 0.998 ...
$ pH : num 3.51 3.2 3.26 3.16 3.51 3.51 3.3 3.39 3.36 3.35 ...
$ sulphates : num 0.56 0.68 0.65 0.58 0.56 0.56 0.46 0.47 0.57 0.8 ...
$ alcohol : num 9.4 9.8 9.8 9.8 9.4 9.4 9.4 10 9.5 10.5 ...
$ quality : int 5 5 5 6 5 5 5 7 7 5 ...
The summary of the two data is omitted here but can be accessed in the initial parts of this file.
Two interesting things interesting in this data:
To analyze this data, first we try to tackle problem no.2 above by deriving correlation coefficients for the 11 attributes, to the quality. Here is our results, which shows that correlation to quality is not strong in any one of the 11 attributes.
- Can we use this data to predict wine type, in other words, a wine classification task based on the chemical analysis data?
- Can we find predictor for wine quality?
To analyze this data, first we try to tackle problem no.2 above by deriving correlation coefficients for the 11 attributes, to the quality. Here is our results, which shows that correlation to quality is not strong in any one of the 11 attributes.
Correlation Coefficients to quality: white wine
fixed.acidity -0.113662831
volatile.acidity -0.194722969 citric.acid -0.009209091 residual.sugar -0.097576829 chlorides -0.209934411 free.sulfur.dioxide 0.008158067 total.sulfur.dioxide -0.174737218 density -0.307123313 pH 0.099427246 sulphates 0.053677877 alcohol 0.435574715 |
Correlation Coefficients to quality: red wine
fixed.acidity 0.12405165
volatile.acidity -0.39055778
citric.acid 0.22637251
residual.sugar 0.01373164
chlorides -0.12890656
free.sulfur.dioxide -0.05065606
total.sulfur.dioxide -0.18510029
density -0.17491923
pH -0.05773139
sulphates 0.25139708
alcohol 0.47616632
volatile.acidity -0.39055778
citric.acid 0.22637251
residual.sugar 0.01373164
chlorides -0.12890656
free.sulfur.dioxide -0.05065606
total.sulfur.dioxide -0.18510029
density -0.17491923
pH -0.05773139
sulphates 0.25139708
alcohol 0.47616632
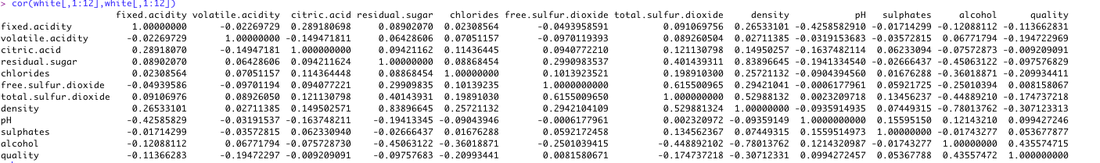
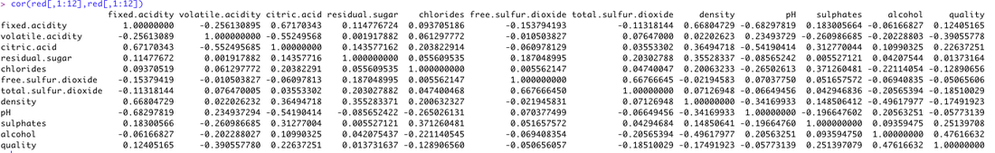
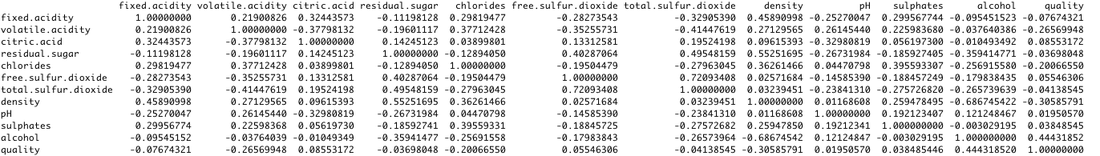
we also derive the correlation matrix for all 12 attributes, for white, red wines respectively, and for them combined (see below). Results shows that correlation value of (r>0.5) is very rare.
white wine:correlation matrix
red wine:correlation matrix
all wines:correlation matrix
Plots:analysis using R plots
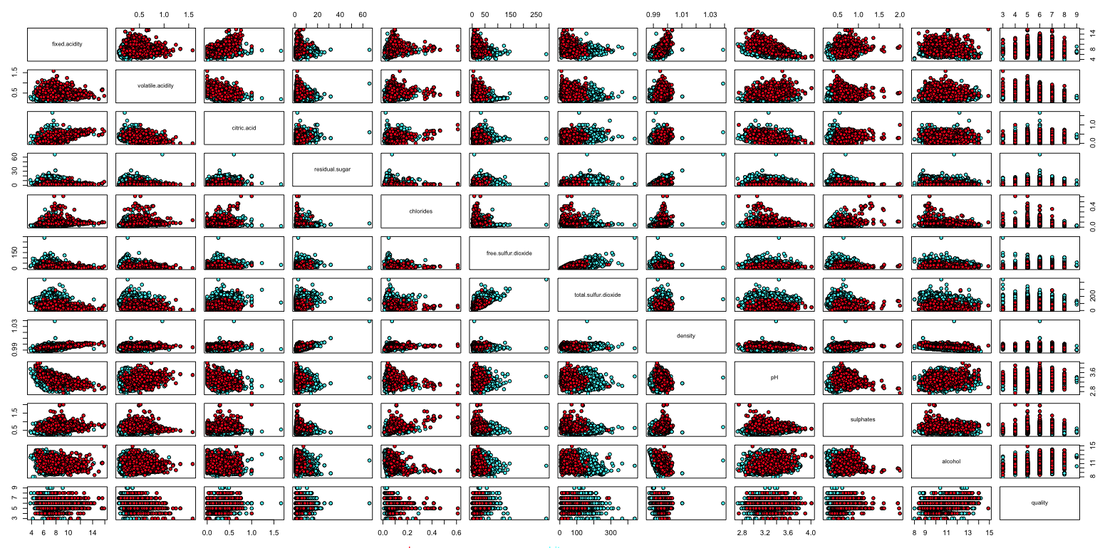
Box plots are available here (for each attribute, graphs for white wine and red wine are plotted in pair, side by side, with white on the right side) :
These do not reveal as much useful information to compare the two wines. The scatter plot shown below indicates that there is much overlap for the pair-wise relationship for both types of wines (see below). Here we have the observation that with the exception of total sulfur dioxide column, all other attributes showed significant overlap between the two wine types (sometimes blue dots are hidden beneath the red ones). In the quality row and column, we see that sometimes the overall value distribution move according to the direction of the quality scale but this is not significant.
- Box plots 1-4 | 5-8 | 9-12 (1,2,...,12 correspond to the 12 attributes in its order: fixed.acidity, volatile.acidity, citric.acid, residual.sugar, chlorides, free.sulfur.dioxide, total.sulfur.dioxide, density, pH, sulphates, alcohol, quality)
- Histograms 1-8 | 9-12
These do not reveal as much useful information to compare the two wines. The scatter plot shown below indicates that there is much overlap for the pair-wise relationship for both types of wines (see below). Here we have the observation that with the exception of total sulfur dioxide column, all other attributes showed significant overlap between the two wine types (sometimes blue dots are hidden beneath the red ones). In the quality row and column, we see that sometimes the overall value distribution move according to the direction of the quality scale but this is not significant.
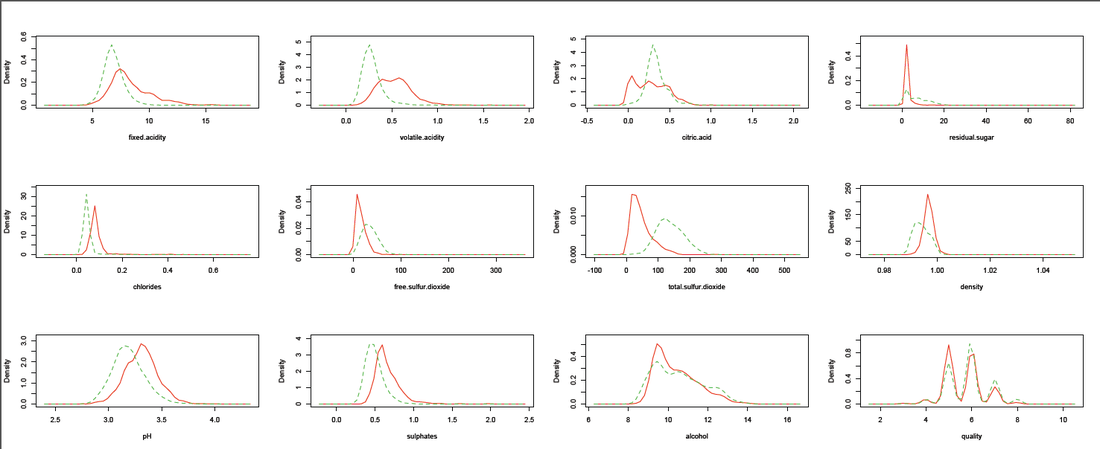
From density plots of two kinds of wines, we can see that total sulfur dioxide (2nd row, 3rd column) is a good indicator of the classification of wine type, whereas chemically free.sulfur dioxide is correlated with total sulfur dioxide:(click for bigger picture)
After we obtained a basic understanding of the data in R, we use Weka to see if we can use the 12 features to classify wine type, or to predict quality based on the first 11 features.
Weka:logistic regression to predict red vs. white wine using 12 features (99% correct)
Weka logistic regression results based on all 12 attributes to predict classification of red vs. white wine:
=== Run information ===
Scheme:weka.classifiers.functions.Logistic -R 1.0E-8 -M -1
Relation: wines
Instances: 6497
Attributes: 13
fixed.acidity
volatile.acidity
citric.acid
residual.sugar
chlorides
free.sulfur.dioxide
total.sulfur.dioxide
density
pH
sulphates
alcohol
quality
kind
Test mode:10-fold cross-validation
=== Classifier model (full training set) ===
Logistic Regression with ridge parameter of 1.0E-8
Coefficients...
Class
Variable red
=======================================
fixed.acidity -0.4005
volatile.acidity 6.722
citric.acid -2.6172
residual.sugar -0.9562
chlorides 22.0115
free.sulfur.dioxide 0.0608
total.sulfur.dioxide -0.0523
density 1875.0433
pH -1.9593
sulphates 2.6927
alcohol 1.7921
quality 0.4339
Intercept -1875.9582
Odds Ratios...
Class
Variable red
=======================================
fixed.acidity 0.67
volatile.acidity 830.4536
citric.acid 0.073
residual.sugar 0.3843
chlorides 3626349994.9526
free.sulfur.dioxide 1.0627
total.sulfur.dioxide 0.9491
density Infinity
pH 0.141
sulphates 14.7716
alcohol 6.0023
quality 1.5432
Time taken to build model: 0.48 seconds
=== Stratified cross-validation ===
=== Summary ===
Correctly Classified Instances 6458 99.3997 %
Incorrectly Classified Instances 39 0.6003 %
Kappa statistic 0.9838
Mean absolute error 0.0129
Root mean squared error 0.0718
Relative absolute error 3.4637 %
Root relative squared error 16.6574 %
Total Number of Instances 6497
=== Detailed Accuracy By Class ===
TP Rate FP Rate Precision Recall F-Measure ROC Area Class
0.985 0.003 0.991 0.985 0.988 0.996 red
0.997 0.015 0.995 0.997 0.996 0.996 white
Weighted Avg. 0.994 0.012 0.994 0.994 0.994 0.996
=== Confusion Matrix ===
a b <-- classified as
1575 24 | a = red
15 4883 | b = white
Weka:feature selection (using 6 features, 97.8% correct)
Feature selection:
in this logistic regression classification task, I used:
1.volatile acidicity
2.residual sugar
3.chlorides
4.free sulfur dioxide
5.total sulfur dioxide
6.sulphates
and we have:
=== Run information ===
Scheme:weka.classifiers.functions.Logistic -R 1.0E-8 -M -1
Relation: wines-weka.filters.unsupervised.attribute.Remove-R1,3,8-9,11-12
Instances: 6497
Attributes: 7
volatile.acidity
residual.sugar
chlorides
free.sulfur.dioxide
total.sulfur.dioxide
sulphates
kind
Test mode:10-fold cross-validation
=== Classifier model (full training set) ===
Logistic Regression with ridge parameter of 1.0E-8
Coefficients...
Class
Variable red
=============================================
volatile.acidity 12.9462
residual.sugar -0.1777
chlorides 38.5093
free.sulfur.dioxide 0.0419
total.sulfur.dioxide -0.0673
sulphates 10.2436
Intercept -8.753
Odds Ratios...
Class
Variable red
=============================================
volatile.acidity 419227.9842
residual.sugar 0.8372
chlorides 5.3009704743056816E16
free.sulfur.dioxide 1.0427
total.sulfur.dioxide 0.9349
sulphates 28101.7054
Time taken to build model: 0.1 seconds
=== Stratified cross-validation ===
=== Summary ===
Correctly Classified Instances 6354 97.799 %
Incorrectly Classified Instances 143 2.201 %
Kappa statistic 0.9405
Mean absolute error 0.0359
Root mean squared error 0.1302
Relative absolute error 9.6607 %
Root relative squared error 30.2378 %
Total Number of Instances 6497
=== Detailed Accuracy By Class ===
TP Rate FP Rate Precision Recall F-Measure ROC Area Class
0.951 0.013 0.959 0.951 0.955 0.994 red
0.987 0.049 0.984 0.987 0.985 0.994 white
Weighted Avg. 0.978 0.04 0.978 0.978 0.978 0.994
=== Confusion Matrix ===
a b <-- classified as
1521 78 | a = red
65 4833 | b = white
weka:feature selection (only use 3 features, 95.6% correct)
If we use only three attributes:
1.volatile acidity
2.free sulfur dioxide
3.total sulfur dioxide
we have:
=== Run information ===
Scheme:weka.classifiers.functions.Logistic -R 1.0E-8 -M -1
Relation: wines-weka.filters.unsupervised.attribute.Remove-R1,3,8-9,11-12-weka.filters.unsupervised.attribute.Remove-R2-3,6
Instances: 6497
Attributes: 4
volatile.acidity
free.sulfur.dioxide
total.sulfur.dioxide
kind
Test mode:10-fold cross-validation
=== Classifier model (full training set) ===
Logistic Regression with ridge parameter of 1.0E-8
Coefficients...
Class
Variable red
===================================
volatile.acidity 13.6726
free.sulfur.dioxide 0.0579
total.sulfur.dioxide -0.0765
Intercept -0.9228
Odds Ratios...
Class
Variable red
===================================
volatile.acidity 866788.3405
free.sulfur.dioxide 1.0597
total.sulfur.dioxide 0.9263
Time taken to build model: 0.08 seconds
=== Stratified cross-validation ===
=== Summary ===
Correctly Classified Instances 6212 95.6134 %
Incorrectly Classified Instances 285 4.3866 %
Kappa statistic 0.8807
Mean absolute error 0.069
Root mean squared error 0.1818
Relative absolute error 18.5942 %
Root relative squared error 42.2064 %
Total Number of Instances 6497
=== Detailed Accuracy By Class ===
TP Rate FP Rate Precision Recall F-Measure ROC Area Class
0.897 0.024 0.923 0.897 0.91 0.985 red
0.976 0.103 0.967 0.976 0.971 0.985 white
Weighted Avg. 0.956 0.084 0.956 0.956 0.956 0.985
=== Confusion Matrix ===
a b <-- classified as
1434 165 | a = red
120 4778 | b = white
MultilayerPerception -Neural Network Algorithm
predict quality based on all the other 11 numeric attributes
results:
=== Run information ===
Scheme:weka.classifiers.functions.MultilayerPerceptron -L 0.3 -M 0.2 -N 500 -V 0 -S 0 -E 20 -H a
Relation: wines-weka.filters.unsupervised.attribute.Remove-R13
Instances: 6497
Attributes: 12
fixed.acidity
volatile.acidity
citric.acid
residual.sugar
chlorides
free.sulfur.dioxide
total.sulfur.dioxide
density
pH
sulphates
alcohol
quality
Test mode:split 66.0% train, remainder test
=== Classifier model (full training set) ===
Linear Node 0
Inputs Weights
Threshold -0.13470794768709404
Node 1 -0.8140425984378524
Node 2 -2.394775652369456
Node 3 -1.7922786003971802
Node 4 -1.0309204050164782
Node 5 0.8217613123223525
Node 6 1.5634436794396531
Sigmoid Node 1
Inputs Weights
Threshold -2.5372312615004424
Attrib fixed.acidity -3.4353467292260036
Attrib volatile.acidity 2.717209195700648
Attrib citric.acid -2.3978764301884197
Attrib residual.sugar -1.928582051888088
Attrib chlorides 0.18196242045553662
Attrib free.sulfur.dioxide 2.729737794562536
Attrib total.sulfur.dioxide 1.4672477882217736
Attrib density 0.6698982953138056
Attrib pH -0.4250756736900811
Attrib sulphates 1.419881219456906
Attrib alcohol -2.365406796363297
Sigmoid Node 2
Inputs Weights
Threshold -2.9540032636371887
Attrib fixed.acidity 1.444655529338462
Attrib volatile.acidity 1.0720267437480975
Attrib citric.acid 2.0678211809386693
Attrib residual.sugar -1.7492369522338007
Attrib chlorides 0.4836577211374656
Attrib free.sulfur.dioxide 1.3912541723820466
Attrib total.sulfur.dioxide 0.3622304083189112
Attrib density -0.14216651391825935
Attrib pH 2.208019022047694
Attrib sulphates -1.0433295506302074
Attrib alcohol -2.890972498912086
Sigmoid Node 3
Inputs Weights
Threshold 0.9397785090267137
Attrib fixed.acidity 2.3994201223849076
Attrib volatile.acidity 1.6509987633234384
Attrib citric.acid 1.8078757061713477
Attrib residual.sugar 3.5974360089631032
Attrib chlorides 1.3144704228740733
Attrib free.sulfur.dioxide 0.9821112841288827
Attrib total.sulfur.dioxide 3.302828453870828
Attrib density -3.5797337225171852
Attrib pH -2.6315771619170936
Attrib sulphates 0.14200993874911458
Attrib alcohol 1.0509774828999707
Sigmoid Node 4
Inputs Weights
Threshold -21.091508781148768
Attrib fixed.acidity -1.2235538693667747
Attrib volatile.acidity 1.0421147316442396
Attrib citric.acid 0.35789387132071787
Attrib residual.sugar -2.585249258480032
Attrib chlorides -2.55665174513596
Attrib free.sulfur.dioxide -15.02253081198439
Attrib total.sulfur.dioxide 1.0203033989684784
Attrib density 1.7931901319122088
Attrib pH -0.8867705129716686
Attrib sulphates -4.2628659401066695
Attrib alcohol -0.1030344483238834
Sigmoid Node 5
Inputs Weights
Threshold -3.5110189790049926
Attrib fixed.acidity 3.1738733330075504
Attrib volatile.acidity -1.0883962273956123
Attrib citric.acid 0.44879356812949545
Attrib residual.sugar 3.998387291298288
Attrib chlorides -4.6484852232824485
Attrib free.sulfur.dioxide 4.178324937053386
Attrib total.sulfur.dioxide -2.5830063987352294
Attrib density -9.065487315887633
Attrib pH 2.4068933372539587
Attrib sulphates 3.258347683307487
Attrib alcohol 0.8769012870181575
Sigmoid Node 6
Inputs Weights
Threshold -14.46389372659305
Attrib fixed.acidity -0.995520607280129
Attrib volatile.acidity -0.41045503783485293
Attrib citric.acid 1.012175326523596
Attrib residual.sugar 5.081872436816134
Attrib chlorides -3.918155011611399
Attrib free.sulfur.dioxide -4.356085037655535
Attrib total.sulfur.dioxide 3.3837266116895828
Attrib density -8.156370700362535
Attrib pH -0.876014967097169
Attrib sulphates -3.700771306885877
Attrib alcohol 1.1044057571537886
Class
Input
Node 0
Time taken to build model: 7.1 seconds
=== Summary ===
Correlation coefficient 0.5461
Mean absolute error 0.6984
Root mean squared error 0.8741
Relative absolute error 101.804 %
Root relative squared error 100.5812 %
Total Number of Instances 2209
Conclusion
In this analysis, I have explored different ways, numeric or graphic, to represent the data relationships and correlations, as well as using Weka Regression and Neural Network algorithm to attempt classification task of red vs. white wines.
From density plots and scatter plot of two kinds of wines, we can see that total sulfur dioxide (2nd row, 3rd column) is a good indicator of the classification of wine type, whereas chemically free.sulfur dioxide is correlated with total sulfur dioxide. Correlation between any other attributes is not strong.
The Weka logistic regression classification results:
Neural network prediction of quality (66% training data):
Correlation coefficient 0.5461
Mean absolute error 0.6984
Root mean squared error 0.8741
Relative absolute error 101.804 %
Root relative squared error 100.5812 %
Total Number of Instances 2209
From density plots and scatter plot of two kinds of wines, we can see that total sulfur dioxide (2nd row, 3rd column) is a good indicator of the classification of wine type, whereas chemically free.sulfur dioxide is correlated with total sulfur dioxide. Correlation between any other attributes is not strong.
The Weka logistic regression classification results:
- 12 features, 99% correct
- 6 features, 97.8% correct
- 3 features, 95.6% correct
Neural network prediction of quality (66% training data):
Correlation coefficient 0.5461
Mean absolute error 0.6984
Root mean squared error 0.8741
Relative absolute error 101.804 %
Root relative squared error 100.5812 %
Total Number of Instances 2209
