Glass data analysis
In this analysis we explore different strategies of binning data to see what effect it has on the performance of OneR classification algorithm.
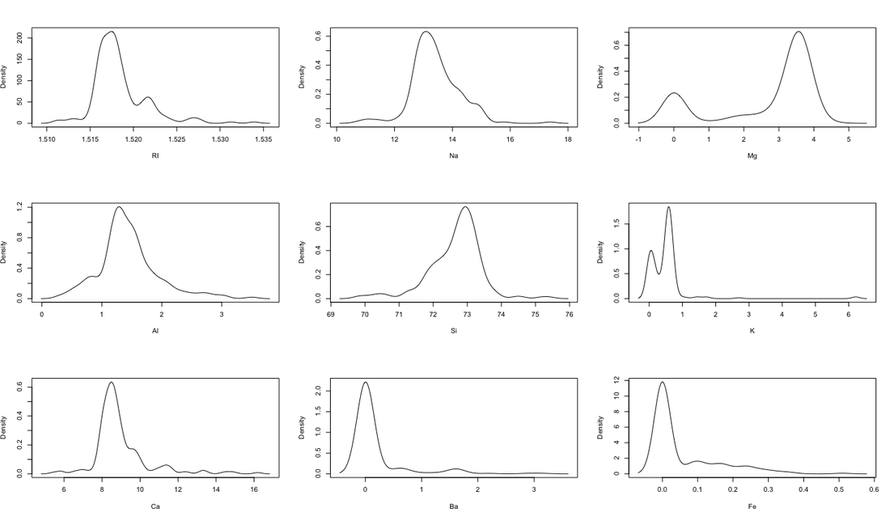
First, here is the density plot showing the original data before Equal Width or Equal Depth binning is applied, for the nine chemical elements analyzed(left):
First, here is the density plot showing the original data before Equal Width or Equal Depth binning is applied, for the nine chemical elements analyzed(left):
|
|
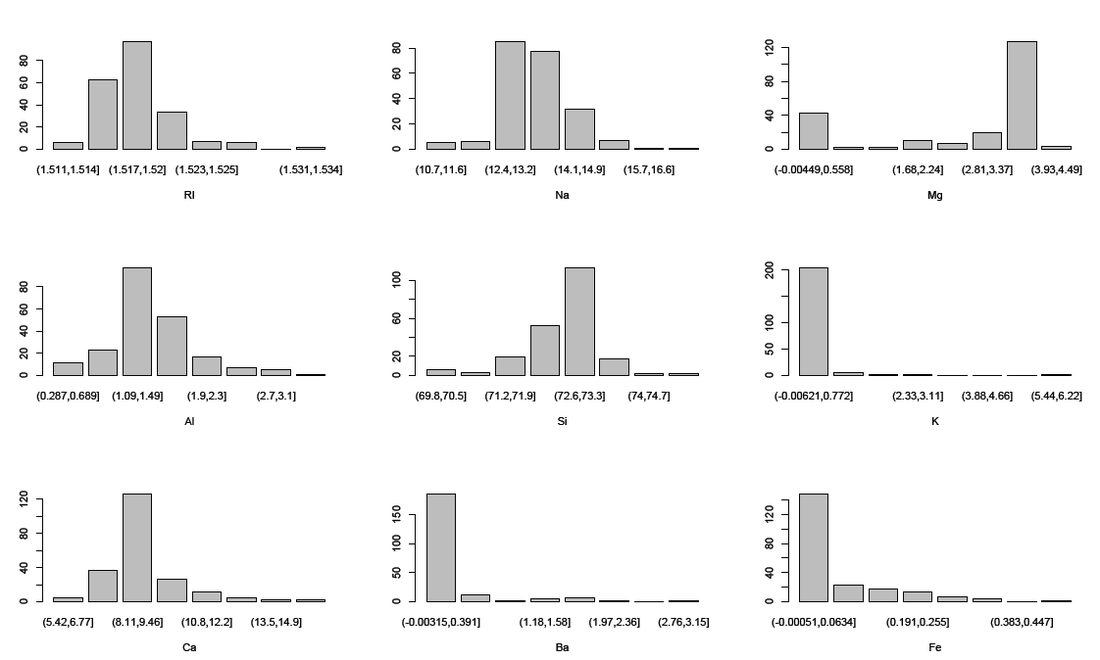
We use number of bins = log2(214)=7.8, so we use 8 bins. The equal width binning is shown here(above right). (plots from Equal Depth is omitted here because we can anticipate what they look like).
comparing these two plots, we see that the equal width binning did not have a great effect on the visualization of this particular data set. Although we notice the peculiarity in that density plot shows different peaks than the binned data by Equal width binning.
A density plot by glass type shows that this data is rather mixed together in terms of types:(each color represents a different glass type)
A density plot by glass type shows that this data is rather mixed together in terms of types:(each color represents a different glass type)
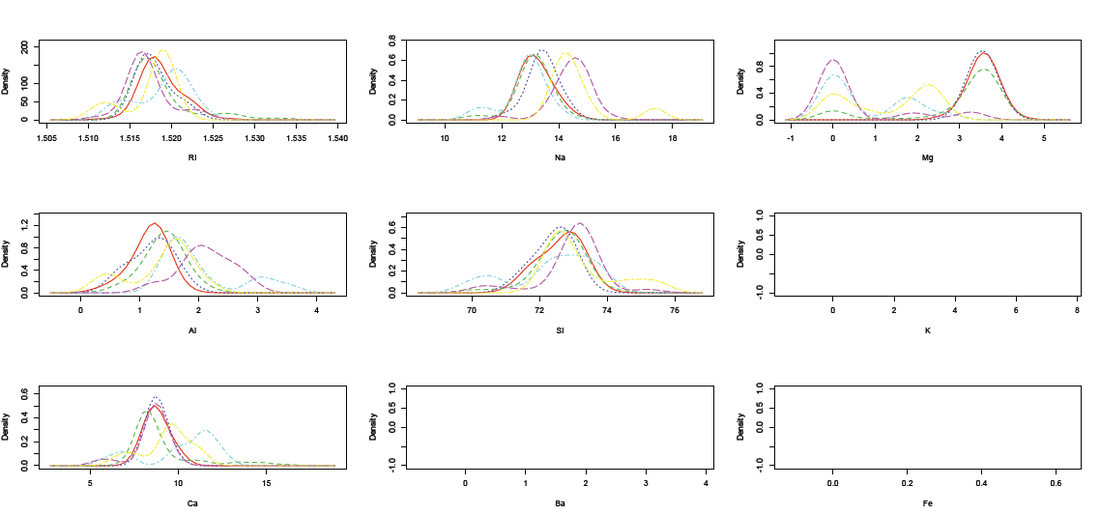
From this comparison, we see that RI, Na, and Si are less of a good indicator of type, and Mg and Al are a little better, although not ideal. Let's first see the results from Weka classification using OneR algorithm, by Equal Width, Equal Depth (Equal frequency in Weka), and by original data. Due to the nature of OneR we do not expect to see a results with high correctness rate.
From the Weka results, it seems that the parameter "ignore class"=true or false does not make a difference in the results, so we do not show the distinction on that parameter here.
In Weka preprocessing, we choose filter->unsupervised->discretize;
We run the OneR algorithm with these different conditions, and the correct classification rates are summarized:
(1)Equal depth, #bin=10 for all variables (default);(56% correct)
(2)Equal depth, #bin=log2(214)=8 for all variables;(57% correct)
(3)Equal width, #bin=8 for all variables;(51% correct)
(4)Equal width, #bin is optimized to be different for each variable automatically (findNumOfBins=True). In particular, these numbers are found for the 9 variables: 6,4,8,4,8,2,5,4,3,7. (44% correct only)
(5)Original data, without binning (58% correct,best result).
The original log of Weka OneR results for each of these conditions is accessible here(text file).
Discussion
It is observed that in all but one of these conditions, the OneR found Aluminum to be the variable for classification. The exception is the condition (4), where the number of bins is automatically found by the discretization. In that case, Magnesium is found to be the variable for classification, resulting in the worst performance:
=== Run information ===
Scheme:weka.classifiers.rules.OneR -B 6
Relation: Glass-weka.filters.unsupervised.attribute.Discretize-O-B8-M-1.0-Rfirst-last
Instances: 214
Attributes: 10
RI
Na
Mg
Al
Si
K
Ca
Ba
Fe
Type
Test mode:10-fold cross-validation
=== Classifier model (full training set) ===
Mg:
'(-inf-0.56125]' -> headlamps
'(0.56125-1.1225]' -> build wind non-float
'(1.1225-1.68375]' -> build wind non-float
'(1.68375-2.245]' -> containers
'(2.245-2.80625]' -> build wind non-float
'(2.80625-3.3675]' -> build wind non-float
'(3.3675-3.92875]' -> build wind float
'(3.92875-inf)' -> build wind non-float
(107/214 instances correct)
Time taken to build model: 0 seconds
=== Stratified cross-validation ===
=== Summary ===
Correctly Classified Instances 96 44.8598 %
Incorrectly Classified Instances 118 55.1402 %
Kappa statistic 0.2231
Mean absolute error 0.1575
Root mean squared error 0.3969
Relative absolute error 74.3975 %
Root relative squared error 122.2995 %
Total Number of Instances 214
In the current data analysis, we see that the binning methods did not have a huge effect on the performance of OneR, partly due to the limitations of the OneR itself. However, we do observe that the original data set without binning resulted in the best performance, optimizing the performance of OneR. The more differentiation of binning there is, the worse the result (finding the number of bins for each variable yielded the worst). All in all, as we see from the density comparison plot above, it is not obvious whether Mg or Al alone is a better variable for classification (indeed their results are not drastically different), but at least OneR consistently found one of these in all cases, in accordance to our prediction from visualization.
